“Data is the new oil,” once said Clive Humby, a British mathematician and entrepreneur.
Precious as it is, just collecting tons of data is not going to bring you riches or grow your business. You have to use it and put it to work.
Helping businesses to understand and employ data is CRM analytics, giving companies insights into many activity areas.
Customer experiences, internal workflows, ongoing sales, and more – can all be managed by analyzing key metrics for success. While 87% of businesses measure surface-level metrics, only 40% are diving deep into the data to find valuable information they can use to turn into revenue-boosting action.
So, how can you make the most out of your CRM solution when it comes to analytics?
Let’s look at the role CRM analytics play in creating successful customer relationships and growing your business.
Why is CRM analytics important?
One of the most significant features of a CRM software is that you can track numerous metrics that matter to your business. After all, you can’t fix something if you don’t know that it’s not working correctly.
One of the areas worth analyzing is whether you’re good at maintaining good relationships with your customers. And a CRM system can be of significant help here.
Obviously, companies that don’t take good care of their customers don’t end up doing very well in the end. In fact, businesses with a customer-focused mindset are 60% more profitable than companies without it, while over 80% of companies who prioritize customer experience are reporting an increase in revenue.
CRM software enhances your ability to create positive experiences throughout the entire customer journey. CRM analytics help you see how your customers are doing, so you can provide them with the best possible service and grow your business.
Analyzing your CRM metrics also helps you understand where your business currently stands and know what you need to improve, whether that means using sales enablement initiatives, changing your marketing strategy, or beefing up your customer support.
Types of CRM metrics
Which CRM analytics should you be tracking? First, let’s talk about the two main types of CRM metrics. Then, we’ll give specific examples of indicators your business can analyze and track to reach your goals.
Internal metrics
Internal CRM metrics are related to internal operations. It’s essential to analyze internal metrics to better understand what is going well in your organization and what needs some improvement. You can learn how well your teams are adjusting to the change and whether or not they are using your CRM tool.
Some indicators that you might want to look at in this scenario include:
- User login frequency
- New record creations
- Lead abandonment rate
- Other sales funnel pipeline activities
Once you have analyzed these CRM adoption metrics, you will better grasp how your organization uses the tool and how your teams can use it better. Also, these metrics can help you understand why your sales and marketing efforts are succeeding or failing.
You can apply this example to any internal activities by choosing what metrics to measure and analyze.
External metrics
External CRM metrics are related to how your business performs in the real world. Analyzing these metrics will give you a clear picture of what is selling, what isn’t, and how to connect with your customers better.
Making informed business decisions starts with collecting and analyzing CRM metrics. External reference points drive businesses to serve their clients and reach new goals.
For example, you might want to know how many customers are clicking links on your landing pages. You can analyze metrics to learn how effective your landing pages are and how much attention your links are getting.
Some marketing-related metrics you could look at in this scenario include:
- Customer origin (how did they get to your landing page)
- Landing page conversion rate
- Clicks without conversions
- Sign-ups captured
Once you have analyzed these external metrics, you begin to realize what your customers are expecting from your brand, and you have a better understanding of how to give them what they want.
Customer perception metrics
Customer perception metrics show you how customers are interacting with your organization. Are they happy? Are there communication methods your target audience prefers? Do your email marketing messages convert?
Business performance metrics
Business performance metrics refer to metrics that indicate how well your company is performing in the market. These metrics measure your current standing and any progress you make toward company goals – be it your sale performance or revenue targets.
With the help of CRM analytics you can measure of a variety of activity areas and see what the data that you’ve collected shows you. Only facts. No guesses.
Next, you can compare this fact-based evidence with your goals. Did you do well in achieving them?
11 CRM analytics you should be tracking
Now that you know why CRM analytics are so important to businesses and the types of metrics that you can track, let's get specific.

Here are the 11 CRM metrics that you should be tracking in 2022:
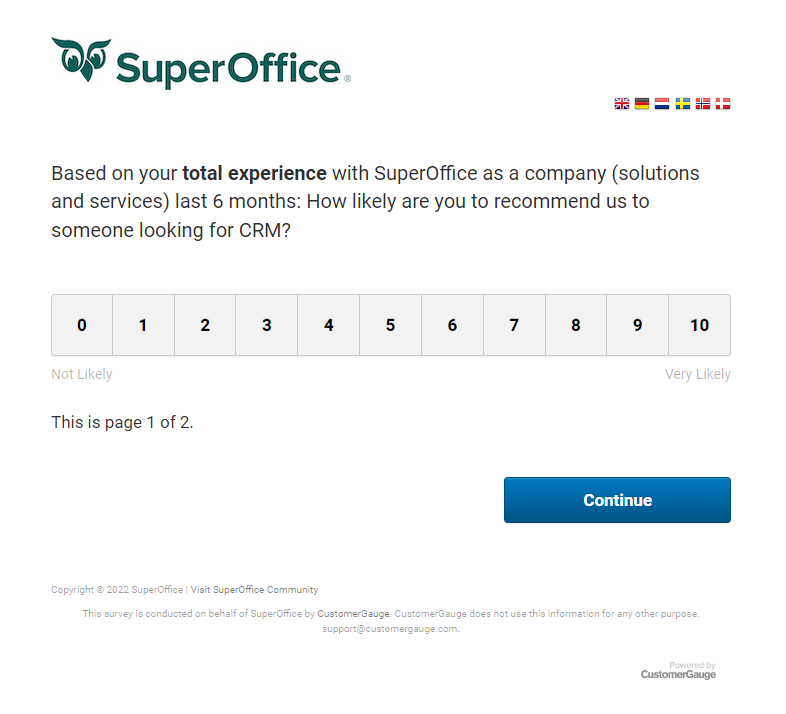
1. Net Promoter Score (NPS)
This score measures how satisfied your customers are. Ask clients to rate their experience with your business from 1-10 to find out how they feel about your company.
Ratings of 0-6 indicate customers that detract from your company. Ratings of 7-8 indicate customers that passively enjoy your product but don’t have an attachment to your business.
Finally, ratings of 9-10 come from customers that are likely to recommend your product to others. These are your promoters.
This feedback system can be tweaked and defined however you choose. The point is to have a system that can help you understand how your customers feel about your brand.
2. Customer Effort Score (CES)
This score also measures customer satisfaction, but in a slightly different way. It reflects how easy or hard it is to work with your organization, according to your customers. You need to ask just one question. How much effort do they have to put in to receive an item, or have their questions answered, or reach support?
Here is an example of a CES question:
Please rate the following statement: “The company X made it easy for me to handle my issue”.
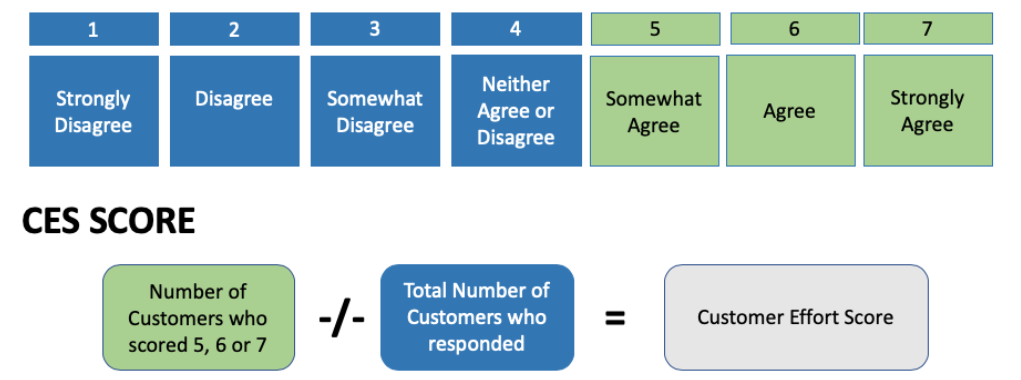
You can ask customers to rate your company from 1 (very low effort) to 7 (very high effort), zero to 100, or another custom range. The lower your CES score, the less satisfied your buyers are with their experience.
3. Rate of renewal
The rate of renewal metric applies mainly to businesses that use a subscription-based sales model. This CRM metric measures how many customers choose to renew their subscription to your service when it expires.
The rate of renewal shows you how important your product is to your customers and gives you an understanding of how quickly your business is growing.
4. Customer churn
Customer turnover, customer attrition, customer churn — whatever you decide to call it, this metric tells you how many customers you’ve lost over a certain period.
There are many reasons why you might want to track this metric. But, the most important reason to analyze customer churn is to discover what is causing your customers to leave and how you can keep more customers in the future.
5. Sales cycle duration
he sales cycle duration metric shows how long it takes your business to close a sale from lead to conversion. The length of your sales cycle will depend on many different factors, so avoid comparing your sales cycle to organizations outside your industry. Instead, focus on the events that lead to conversions and how many touches it takes to seal the deal.
6. Customer Acquisition Cost (CAC)
This metric measures how much it costs on average for your business to acquire one new customer. It applies marketing, staffing, training, software costs, and other expenses that go into making a single sale. You can use this CRM metric to discover if you need to find ways to automate and reduce costs or if you have some wiggle room to start an initiative to bring more customers in.
7. Net new revenue
How much new business are you bringing in? Measuring your net new revenue tells you how much money your organization makes from acquiring new business monthly, quarterly, or annually. Use this metric to discover whether your marketing campaigns, triggered emails, or other events spur new growth.
8. Customer retention cost
This metric is similar to the customer acquisition cost. But instead of measuring how much each new buyer costs your business, this indicator measures how much it costs your company to retain your existing customers.
Continued marketing emails, retargeting efforts, and customer loyalty programs are all efforts that cost businesses money to retain customers. Use this metric to determine if your retention efforts are worth the trouble. (spoiler alert: they are!)
9. Customer Lifetime Value (CLV)
Measure the customer lifetime value to discover how much revenue you receive from a single customer for as long as they continue to buy from your company. CLV can tell you things about your business, such as if a customer is happy or finds value in your products. If you have a low overall CLV, you can work to improve your customer satisfaction, service offerings, or customer experience.
If a CLV is high, use those insights to give other customers the same value.
10. Marketing ROI
Marketing ROI measures how far your marketing expenses take your business. Are you spending too much on marketing? Maybe if you spent more, your ROI would improve? Use this metric to understand if your marketing budget is justified and whether or not your campaigns are working.
11. Traffic to lead conversion ratio
Calculating how much website traffic actually results in conversion can help you understand many things about your audience. For example, is your content resonating with your customers? Are you making it clear what you want them to do (sign up, make a purchase, etc.)?
To calculate the traffic to lead conversion ratio, take the number of website visitors and divide it by the number of leads, then, multiply the answer by 100.
Your traffic to lead conversion ratio helps you understand your audience better by measuring how many of your website visitors convert.
Wrapping up
To make sense of your CRM data and improve your business performance you need to track analytics.
Since implementing CRM tools, 47% of businesses reported an increase in customer satisfaction. To take that satisfaction to the next level, it’s vital to track CRM analytics that give you a clear picture of your company’s performance.
So, the ball is in your court now. Run through the analytics above and prioritize them based on the order that you think is most relevant and your current circumstances. The results you gain from these metrics are invaluable, as they show where your business is failing and where it is succeeding.
Want to learn more about SuperOfice CRM? Book a free demo.