
Post summary:
- How do you track support requests today?
- How can you automate customer service request tracking?
- 6 key customer service reports every support manager needs
How many customer service requests have you received today?
More importantly, how many requests have been responded to?
Sure, you can take a wild guess, but that won’t get you very far.
Or, you do what many customer service managers do – count them. One by one.
However, if you're tired of manually counting customer requests using post-it notes and spreadsheets, then what you need is a solution that provides out-of-the-box reports that automatically turns raw numbers into visual data.
This is where customer service software can help you.
How, you ask?
It's because customer service software includes out-of-the-box customer service reports!
Customer service reports provide an overview of all customer service requests so you can keep track of the trends, which allow you to identify areas for improvement, plan the workload and schedules of your support team and, most importantly, make sure your customers’ expectations are well met.
6 Customer service reports for better support
In this article, we’ve outlined 6 essential customer service reports to help increase the quality of customer service you deliver.
1. Number of requests received per day
The “number of requests received” report shows you how many customer requests you have received within the last day(s). Knowing the number of requests you receive helps you identify customer service trends and gives you insight for how you can plan and schedule your support team.
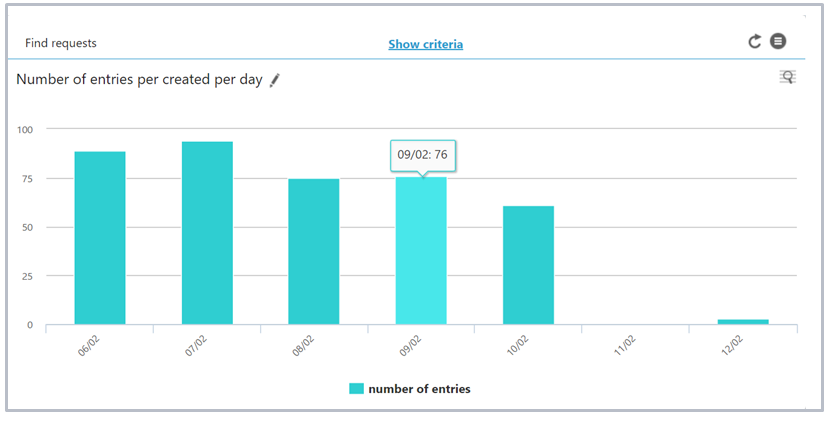
For example, if you start to notice an increase in requests on Saturdays and Sundays, it might mean that you need to schedule your team to work on the weekend.
Another example could be that the number of requests suddenly increases by twice as many overnight due to the success of the new email marketing campaign. Therefore, the next time your marketing team plans to send out an email campaign, you know to schedule in more staff on the following day in order to answer these requests in a timely manner.
Just remember to respond as more than 60% of companies do not respond to customer service requests!
2. Number of requests closed per user
The “number of requests closed per user” report provides an overview of how many requests each support agent is closing. With this report, you can measure the performance of individual customer service agents, allowing you to identify how productive each agent is and how many requests they are able to handle.
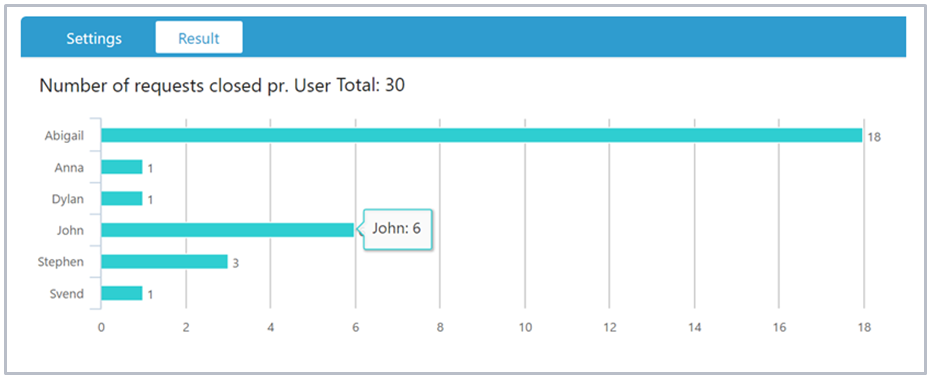
If you find that an agent is answering twice as many requests as the rest of your team, it might mean that the agent is “cherry picking” the easy requests over the more difficult ones. One way to solve this is to automatically assign requests to the next available agent so that all requests are distributed equally.
Another example might be that one agent is answering too few requests compared to the rest of the team. If an agent is struggling, then you should consider conducting a training session. Find out what’s slowing them down and suggest ways they can improve their workflow.
3. Average response time
According to a study by Live Person, 82% of customers say the number one factor to great customer service is having their issues resolved quickly. This is why it’s important to measure how long it takes you to respond to a customer!
However, based on research from our customer service benchmark report, the average response time is an appalling 12 hours and 10 minutes.
Average response time is calculated from the time a request has been sent by a customer, to the time an agent has responded. For example, if a customer sends a request at 3pm and a customer service agent responds by 4pm, then the response time is one hour.
The faster you can respond to a customer, the better service you deliver.
If you find it is taking too long to respond to customer service requests, if could be due to the fact that the right department or agent isn’t receiving the request and that the delay occurs when trying to find the right contact person.
Another reason for taking too long to respond might be due to the responses themselves. Are your agents creating each response from scratch? Are lengthy emails slowing down your response time?
This is where customer service software can help you. For example, if an agent responds to a customer and the customer replies, the same agent will receive the customers reply. Another benefit is that instead of creating a new response from scratch, you can create a set of customer support email templates that all of your agents have access to. This way, all your agents can select well-written email templates and respond as quickly as possible.
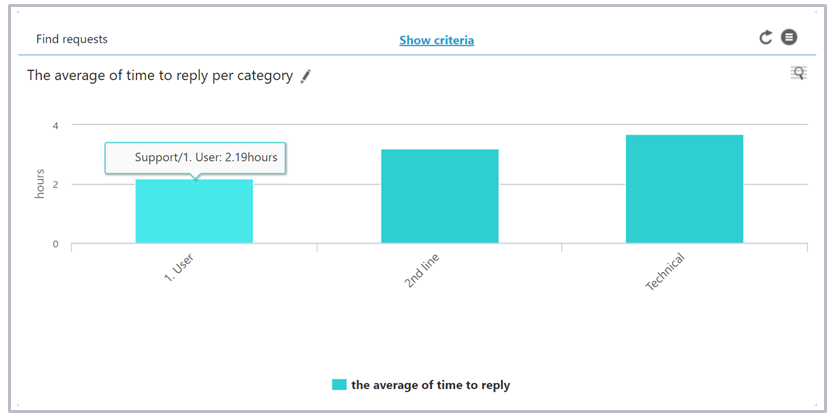
4. Average handle time
The “average time to reply” report shows you how long it takes to handle a customer request. As well as response time, average handle time is essential to achieving best in class customer service. Your customers not only expect to get a response quickly, but they also want their issues handled quickly.
Handle time is calculated from when an agent reads a request to when an agent responds to the customer.
For example, let’s imagine a customer sends in a request to add two new licenses to their account. Your customer support agent reads the request at 3pm, checks the customer’s profile, and adds two new licenses, which takes 15 minutes to complete and then responds at 3.20pm. This would be reported as a handle time of 20 minutes.
What you’re looking for is a gradual decline in the time it takes to handle requests (as shown above).
If you see that the average handle time is increasing, it means your team is becoming less efficient and may require additional training. A well-trained customer service agent will reduce the handle time by knowing how to use CRM software to find the customers' complete profile, which email templates to use and who to contact if a request needs to be escalated.
Another benefit of using customer service software is that you can prioritize requests that have not been responded to within a specific time frame. For example, if a request has not been assigned to an agent within two hours, it will be automatically distributed to the next available agent. This way, no request goes unanswered!
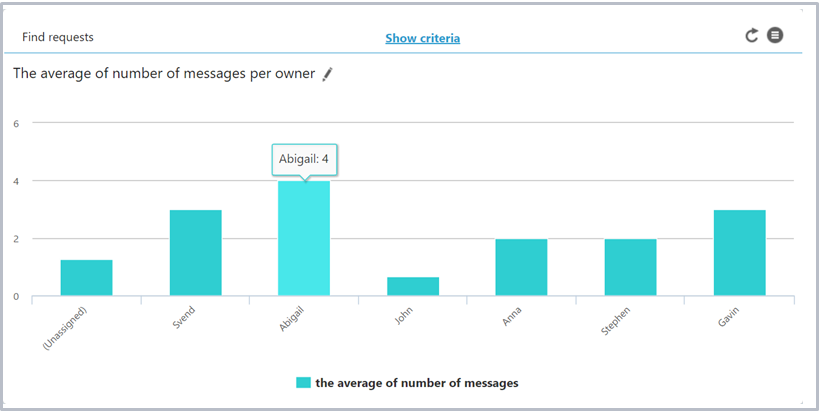
5. Number of messages per owner
Customers don’t enjoy endless back and forth messages with customer service departments and prefer to have their issues handled by an agent who has all the right information, asks all the right questions and gives accurate answers, within the first reply.
What is first contact resolution?
It’s when you can resolve a customer issue in your first response (first contact).
Only 11% of companies are able to manage customer requests in the first reply.
This report tells you how much effort your customers have to put in to get their issues solved.
A high number of messages could indicate that the request responses from your team are not detailed enough.
For example, let’s imagine that a customer sends in a request asking for your company’s contact number. An agent could respond to the request with generic phone number. While that does “solve” the customer’s request, it could also lead to further questions from the customer (what are your open hours? Are you available on weekends?), which leads to a high number of messages and a low first contact resolution rate.
However, an agent could easily include all of these details within the first response, which would lead to a high first contact resolution rate.
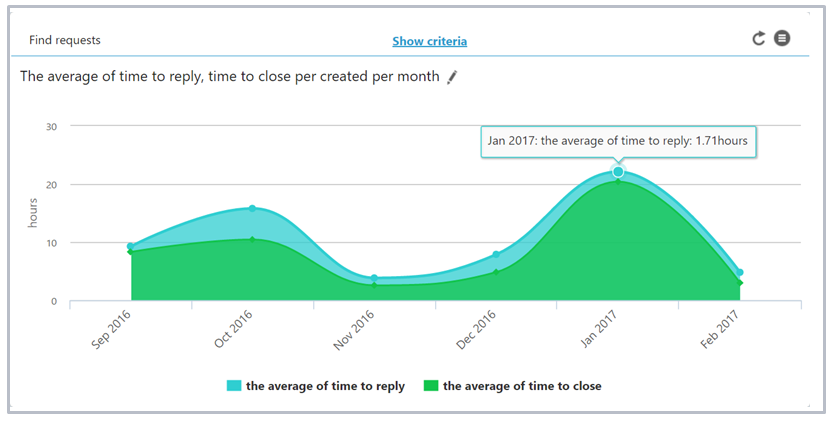
6. Number of requests created per month
The “number of requests created per month” report is an important report for identifying customer request trends.
Like any business, you will have your high season and your low season. If you sell your product or service to businesses, you can expect a high volume of requests during the work week and you can expect the number of requests to drop during the weekends.
Earlier in this article, we covered number of requests per day (report number one), which is great for managing your team on a week by week basis. However, when planning long-term, you need to think about new hires, vacations, off-site team building activities and national holidays.
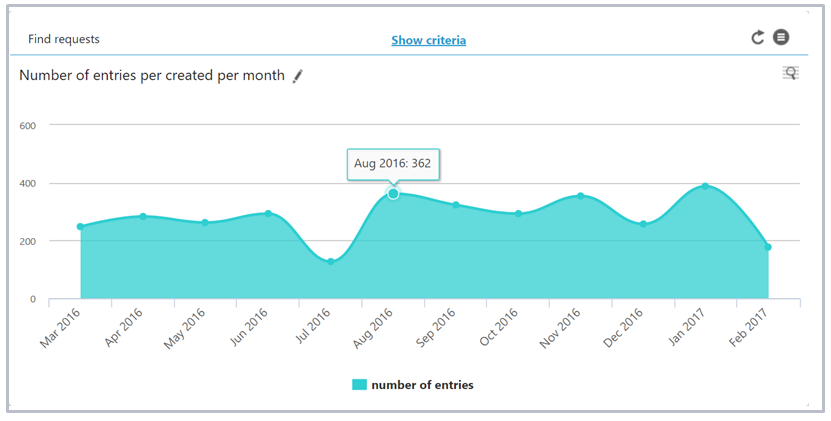
This report gives you key insight into how you plan your team efficiently. If summer is a quiet period (as shown in the report above), then schedule vacation time in during the summer. If you know that January is a busy time for you, then see if you could hire part-time staff to cover the additional workload.
Conclusion
When there’s so much data available, it’s easy to spend time reading the wrong reports.
And there’s no use in getting bogged down in data without knowing what to actually do with it. The reason you are reviewing this data is so you can make better decisions, improve your processes and understand how your team is performing.
By using these customer service reports, you can keep track of trends, employee productivity and customer satisfaction, all of which have a significant impact on your bottom line.
What are your favorite customer service reports?
P.S. If you enjoyed this article and think others should read it, please share it on Twitter.